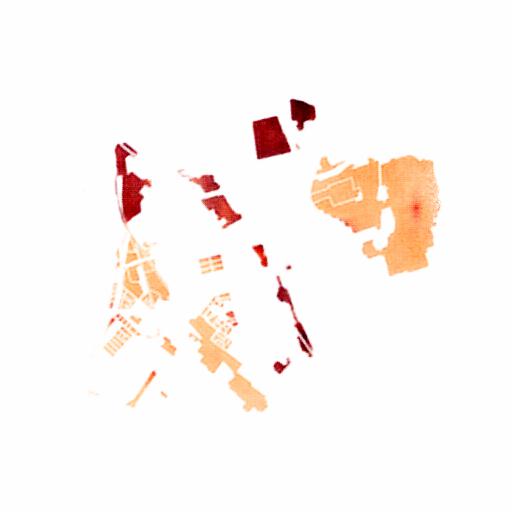
Ground Truth

Generation
CAGAN
Stage 1: A light pollution image classifier is trained with actual light pollution images, enabling it to establish accurate associations with given residential area light pollution maps.
Stage 2: A conditional variational autoencoder is trained exclusively using the base map without colorization. The generator is then guided by the classifier and discriminator to progressively generate authentic light pollution maps.
Causality Interpretability: Deliberately adjusting the average nighttime light intensity of various building types within residential areas leads to observable changes in brightness across different regions.

